B) False
Correct Answer

verified
Correct Answer
verified
True/False
An outcome is said to be efficient if an economy is getting all it can from the scarce resources it has available.
B) False
Correct Answer

verified
Correct Answer
verified
Short Answer
Table 2-6 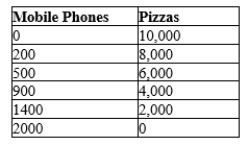 -Refer to Table 2-6. Consider the production possibilities table for an economy that produces only mobile phones and pizzas. What is the opportunity cost of increasing production of mobile phones from 200 to 500?
Correct Answer

verified
Correct Answer
verified
Multiple Choice
A certain production possibilities frontier shows production possibilities for two goods, jewelry and clothing. Which of the following concepts cannot be illustrated by this model?
A) the flow of dollars between sellers of jewelry and clothing and buyers of jewelry and clothing
B) the tradeoff between production of jewelry and production of clothing
C) the opportunity cost of clothing in terms of jewelry
D) the effect of economic growth on production possibilities involving jewelry and clothing
F) B) and C)
Correct Answer

verified
Correct Answer
verified
Short Answer
Table 2-6  -Refer to Table 2-6. Consider the production possibilities table for an economy that produces only mobile phones and pizzas. Describe the shape of the production possibilities frontier.
Correct Answer

verified
Correct Answer
verified
Multiple Choice
Just like models constructed in other areas of science, economic models
A) incorporate assumptions that contradict reality.
B) incorporate all details of the real world.
C) complicate reality.
D) avoid the use of diagrams and equations.
F) A) and D)
Correct Answer

verified
Correct Answer
verified
Multiple Choice
When economists make
A) positive statements, they are speaking not as scientists but as policy advisers.
B) positive statements, they are speaking not as scientists but as forecasters.
C) normative statements, they are speaking not as scientists but as policy advisers.
D) normative statements, they are speaking not as policy advisers but as model-builders.
F) A) and C)
Correct Answer

verified
Correct Answer
verified
Multiple Choice
Figure 2-9
Panel (a)
Panel (b) 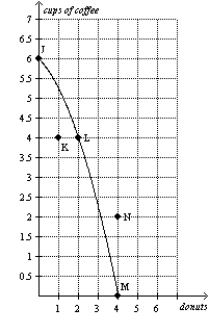
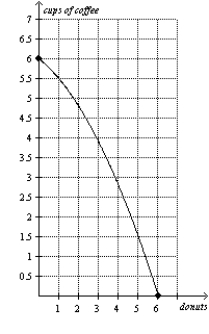 -Refer to Figure 2-9, Panel (a) . The opportunity cost of one cup of coffee is highest when the economy produces
A) 0 cups of coffee.
B) 2 cups of coffee.
C) 4 cups of coffee.
D) 6 cups of coffee.
F) All of the above
Correct Answer

verified
Correct Answer
verified
Short Answer
Figure 2-22 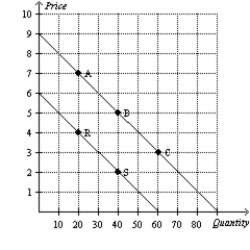 -Refer to Figure 2-22. What is the x-coordinate of point R?
Correct Answer

verified
Correct Answer
verified
Multiple Choice
Which of these statements about economic models is correct?
A) For economists, economic models provide insights about the world.
B) Economic models are built with assumptions.
C) Economic models are often composed of equations and diagrams.
D) All of the above are correct.
F) A) and D)
Correct Answer

verified
Correct Answer
verified
Multiple Choice
Which of the following statements is correct about the roles of economists?
A) Economists are best viewed as policy advisers.
B) Economists are best viewed as scientists.
C) In trying to explain the world, economists are policy advisers; in trying to improve the world, they are scientists.
D) In trying to explain the world, economists are scientists; in trying to improve the world, they are policy advisers.
F) All of the above
Correct Answer

verified
Correct Answer
verified
True/False
A circular-flow diagram is a visual model of the economy.
B) False
Correct Answer

verified
Correct Answer
verified
Multiple Choice
Figure 2-7 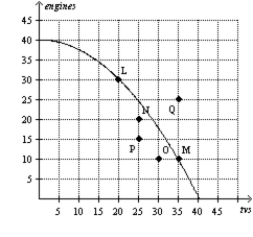 -Refer to Figure 2-7. Inefficient production is represented by which point(s) ?
A) L, M
B) N, O, P, Q
C) N, O, P
D) Q
F) A) and C)
Correct Answer

verified
Correct Answer
verified
Short Answer
Figure 2-14 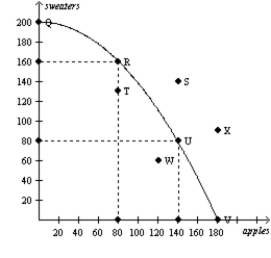 Consider the production possibilities curve for a country that can produce sweaters, apples (in bushels), or a combination of the two.
-Refer to Figure 2-14. The bowed outward shape of the production possibilities curve indicates that opportunity cost of apples in terms of sweaters is
Correct Answer

verified
Correct Answer
verified
Multiple Choice
To display information on two variables, an economist must use
A) a bar graph.
B) a pie chart.
C) the coordinate system.
D) a time-series graph.
F) A) and D)
Correct Answer

verified
Correct Answer
verified
True/False
The slope of a line is equal to the change in the x-variable divided by the change in the y-variable.
B) False
Correct Answer

verified
Correct Answer
verified
True/False
The slope of an upward-sloping line is positive, and the slope of a downward-sloping line is negative.
B) False
Correct Answer

verified
Correct Answer
verified
Multiple Choice
Figure 2-6 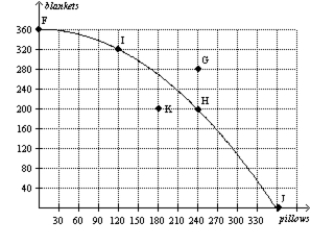 -Refer to Figure 2-6. If this economy devotes one-half of its available resources to the production of blankets and the other half to the production of pillows, it could produce
A) 120 pillows and 320 blankets.
B) 180 pillows and 180 blankets.
C) 240 pillows and 200 blankets.
D) We would have to know the details of this economy's technology in order to determine this.
F) A) and D)
Correct Answer

verified
Correct Answer
verified
Multiple Choice
Economic models
A) are not useful because they omit many real-world details.
B) are usually composed of diagrams and equations.
C) are useful because they do not omit any real-world details.
D) are usually plastic representations of the economy.
F) A) and D)
Correct Answer

verified
Correct Answer
verified
Multiple Choice
When an economy is operating at a point on its production possibilities frontier, then
A) consumers are content with the mix of goods and services that is being produced.
B) there is no way to produce more of one good without producing less of the other.
C) equal amounts of the two goods are being produced.
D) All of the above are correct.
F) None of the above
Correct Answer

verified
Correct Answer
verified
Showing 81 - 100 of 643
Related Exams