A) upper quartile mark
B) an outlier
C) a whisker
D) a deviation
F) A) and D)
Correct Answer

verified
Correct Answer
verified
Multiple Choice
Carmen is a professor at a local university. In collecting data on her Introduction to Business course for a year, she wants to calculate the z-score for a student who scores a 84 on the final exam. The mean and the standard deviation scores on the exam are 70 and 6, respectively. Calculate the z-score.
A) 1.33
B) 2.33
C) 0.33
D) 2.67
F) A) and D)
Correct Answer

verified
Correct Answer
verified
True/False
A study focused on the following numerical variables: Age, Income, and Candy (lbs). A bubble chart will help the researcher understand the relationship based on the location of the age and income plots and the size of the bubble based on candy consumption.
B) False
Correct Answer

verified
Correct Answer
verified
True/False
An easy way to convert relative frequencies into percentages is by dividing by 100.
B) False
Correct Answer

verified
Correct Answer
verified
Multiple Choice
The following table is the summary statistics for Scores. Calculate the Sharpe ratio of growth. Assume Rf = 4. 
A) 4.322
B) 1.245
C) 7.792
D) 6.989
F) All of the above
Correct Answer

verified
Correct Answer
verified
Multiple Choice
If the coefficient correlation is computed to be -0.15, this means the relationship between the two variables are _______.
A) strong, positive
B) strong, negative
C) weak, positive
D) weak, negative
F) None of the above
Correct Answer

verified
Correct Answer
verified
Multiple Choice
Candice is preparing for her final exam in Statistics. She knows she needs an 68 out of 100 to earn an A overall in the course. Her instructor provided the following information to the students. - On the final, 200 students have taken it with a mean score of 60 and a standard deviation of 6. Assume the distribution of scores is bell-shaped. Calculate to see if a score of 68 is within one standard deviation of the mean.
A) Yes, 68 is the upper limit of one standard deviation from the mean.
B) Yes, the upper level of one standard deviation is 66.
C) Yes, 68 is greater than the 54, one standard deviation below the mean.
D) No, 68 is greater than the mean of 60.
F) B) and D)
Correct Answer

verified
Correct Answer
verified
True/False
Constructing a contingency table allows for a clear visualization of the relationship between two categorical variables.
B) False
Correct Answer

verified
Correct Answer
verified
True/False
A line chart displays the numerical variable of a series of data points connected by a line.
B) False
Correct Answer

verified
Correct Answer
verified
True/False
In a large data set, the arithmetic mean is the primary measure of the central location.
B) False
Correct Answer

verified
Correct Answer
verified
True/False
Converting observations into z-scores is also called doubling the observation.
B) False
Correct Answer

verified
Correct Answer
verified
Multiple Choice
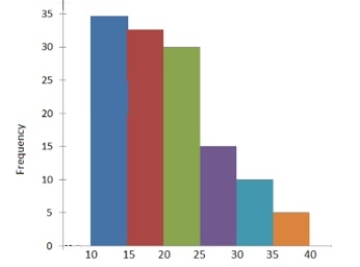
Using the following histogram, how would the distribution be described? 
A) bell-shaped
B) symmetric skewed
C) positively skewed
D) negatively skewed
F) C) and D)
Correct Answer

verified
Correct Answer
verified
Showing 41 - 52 of 52
Related Exams