B) False
Correct Answer

verified
Correct Answer
verified
Multiple Choice
As more people become self-employed, which allows them to determine how many hours they work per week, we would expect the deadweight loss from the Social Security tax to
A) increase, and the revenue generated from the tax to increase.
B) increase, and the revenue generated from the tax to decrease.
C) decrease, and the revenue generated from the tax to increase.
D) decrease, and the revenue generated from the tax to decrease.
F) B) and D)
Correct Answer

verified
Correct Answer
verified
True/False
The result of the large tax cuts in the first Reagan Administration demonstrated very convincingly that Arthur Laffer was correct when he asserted that cuts in tax rates would increase tax revenue.
B) False
Correct Answer

verified
Correct Answer
verified
Multiple Choice
Suppose a tax of $3 per unit is imposed on a good. The supply curve is a typical upward-sloping straight line, and the demand curve is a typical downward-sloping straight line. The tax decreases consumer surplus by $3,900 and decreases producer surplus by $3,000. The tax generates tax revenue of $6,000. The tax decreased the equilibrium quantity of the good from
A) 2,000 to 1,500.
B) 2,400 to 2,000.
C) 2,600 to 2,000.
D) 3,000 to 2,400.
F) A) and C)
Correct Answer

verified
Correct Answer
verified
Multiple Choice
The deadweight loss from a tax of $5 per unit will be smallest in a market with
A) inelastic supply and elastic demand.
B) inelastic supply and inelastic demand.
C) elastic supply and elastic demand.
D) elastic supply and inelastic demand.
F) All of the above
Correct Answer

verified
Correct Answer
verified
Multiple Choice
The graph that represents the amount of deadweight loss (measured on the vertical axis) as a function of the size of the tax (measured on the horizontal axis) looks like
A) a U.
B) an upside-down U.
C) a horizontal straight line.
D) an upward-sloping curve.
F) A) and D)
Correct Answer

verified
Correct Answer
verified
Multiple Choice
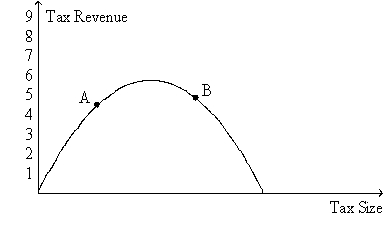
Figure 8-19. The figure represents the relationship between the size of a tax and the tax revenue raised by that tax.  -Refer to Figure 8-19. If the economy is at point A on the curve, then a decrease in the tax rate will
A) increase the deadweight loss of the tax and increase tax revenue.
B) increase the deadweight loss of the tax and decrease tax revenue.
C) decrease the deadweight loss of the tax and increase tax revenue.
D) decrease the deadweight loss of the tax and decrease tax revenue.
F) A) and B)
Correct Answer

verified
Correct Answer
verified
True/False
When a tax is imposed, the loss of consumer surplus and producer surplus as a result of the tax exceeds the tax revenue collected by the government.
B) False
Correct Answer

verified
Correct Answer
verified
Multiple Choice
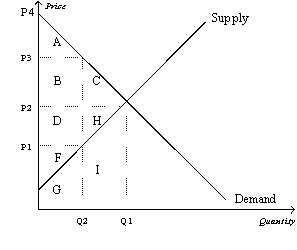
Figure 8-5
Suppose that the government imposes a tax of P3 - P1.  -Refer to Figure 8-5. The benefit to the government is measured by
A) tax revenue and is represented by area A+B.
B) tax revenue and is represented by area B+D.
C) the net gain in total surplus and is represented by area B+D.
D) the net gain in total surplus and is represented by area C+H.
F) A) and D)
Correct Answer

verified
Correct Answer
verified
Multiple Choice
Figure 8-5
Suppose that the government imposes a tax of P3 - P1.  -Refer to Figure 8-5. The total surplus with the tax is represented by area
A) C+H.
B) A+B+C.
C) D+H+F.
D) A+B+D+F.
F) B) and D)
Correct Answer

verified
Correct Answer
verified
Multiple Choice
To fully understand how taxes affect economic well-being, we must
A) assume that economic well-being is not affected if all tax revenue is spent on goods and services for the people who are being taxed.
B) compare the taxes raised in the United States with those raised in other countries, especially France.
C) compare the reduced welfare of buyers and sellers to the amount of revenue the government raises.
D) take into account the fact that almost all taxes reduce the welfare of buyers, increase the welfare of sellers, and raise revenue for the government.
F) B) and C)
Correct Answer

verified
Correct Answer
verified
True/False
The larger the deadweight loss from taxation, the larger the cost of government programs.
B) False
Correct Answer

verified
Correct Answer
verified
True/False
Taxes on labor tend to encourage second earners to stay at home rather than work in the labor force.
B) False
Correct Answer

verified
Correct Answer
verified
Essay
Illustrate on three demand-and-supply graphs how the size of a tax (small, medium and large) can alter total revenue and deadweight loss.
Correct Answer

verified
Correct Answer
verified
Multiple Choice
Andre walks Julia's dog once a day for $50 per week. Julia values this service at $60 per week, while the opportunity cost of Andre's time is $30 per week. The government places a tax of $35 per week on dog walkers. After the tax, what is the total surplus?
A) $50
B) $30
C) $25
D) $0
F) None of the above
Correct Answer

verified
Correct Answer
verified
Multiple Choice
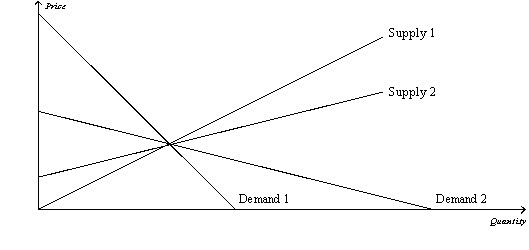
Figure 8-12  -Refer to Figure 8-12. Which of the following combinations will minimize the deadweight loss from a tax?
A) supply 1 and demand 1
B) supply 2 and demand 2
C) supply 1 and demand 2
D) supply 2 and demand 1
F) B) and C)
Correct Answer

verified
Correct Answer
verified
Multiple Choice
When a tax is levied on buyers, the
A) supply curves shifts upward by the amount of the tax.
B) tax creates a wedge between the price buyers effectively pay and the price sellers receive.
C) tax has no effect on the well-being of sellers.
D) All of the above are correct.
F) A) and C)
Correct Answer

verified
Correct Answer
verified
Multiple Choice
Scenario 8-2 Tom mows Stephanie's lawn for $25. Tom's opportunity cost of mowing Stephanie's lawn is $20, and Stephanie's willingness to pay Tom to mow her lawn is $28. -Refer to Scenario 8-2. Assume Tom is required to pay a tax of $10 each time he mows a lawn. Which of the following results is most likely?
A) Stephanie now will decide to mow her own lawn, and Tom will decide it is no longer in his interest to mow Stephanie's lawn.
B) Stephanie still is willing to pay Tom to mow her lawn, but Tom will decline her offer.
C) Tom still is willing to mow Stephanie's lawn, but Stephanie will decide to mow her own lawn.
D) Tom and Stephanie still can engage in a mutually-agreeable trade.
F) A) and B)
Correct Answer

verified
Correct Answer
verified
Multiple Choice
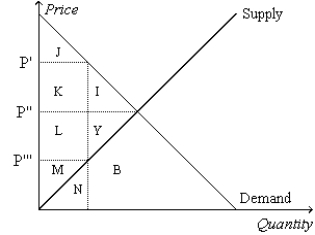
Figure 8-1  -Refer to Figure 8-1. Suppose the government imposes a tax of P' - P'''. The area measured by L+M+Y represents
A) consumer surplus after the tax.
B) consumer surplus before the tax.
C) producer surplus after the tax.
D) producer surplus before the tax.
F) C) and D)
Correct Answer

verified
Correct Answer
verified
Multiple Choice
Figure 8-1  -Refer to Figure 8-1. Suppose the government imposes a tax of P' - P'''. The area measured by K+L represents
A) tax revenue.
B) consumer surplus before the tax.
C) producer surplus after the tax.
D) total surplus before the tax.
F) A) and D)
Correct Answer

verified
Correct Answer
verified
Showing 41 - 60 of 422
Related Exams