Filters
Question type
A) True
B) False
B) False
Correct Answer

verified
Correct Answer
verified
Question 52
True/False
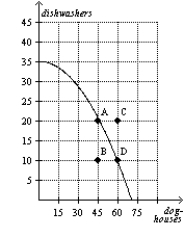
Figure 2-14  -Refer to Figure 2-14.It is possible for this economy to produce 75 doghouses.
A) True
B) False
B) False
Correct Answer

verified
Correct Answer
verified
Question 53
True/False
Microeconomics and macroeconomics are closely intertwined.
A) True
B) False
B) False
Correct Answer

verified
Correct Answer
verified
Question 54
True/False
When economists are trying to explain the world,they are scientists,and when they are trying to help improve the world,they are policy advisers.
A) True
B) False
B) False
Correct Answer

verified
Correct Answer
verified
Question 55
True/False
The slope of a horizontal line is infinite,and the slope of a vertical line is zero.
A) True
B) False
B) False
Correct Answer

verified
Correct Answer
verified
Question 56
True/False
Changes in one variable on a graph might be caused by the other variable on the graph or by a third omitted variable.
A) True
B) False
B) False
Correct Answer

verified
Correct Answer
verified
Question 57
True/False
Economists usually have to make do with whatever data the world happens to give them.
A) True
B) False
B) False
Correct Answer

verified
Correct Answer
verified
Question 58
True/False
Economists try to address their subject with a scientist's objectivity.
A) True
B) False
B) False
Correct Answer

verified
Correct Answer
verified
Question 59
True/False
When a production possibilities frontier is bowed outward,the opportunity cost of one good in terms of the other is constant.
A) True
B) False
B) False
Correct Answer

verified
Correct Answer
verified
Question 60
True/False
Different values are not a reason for disagreement among economists.
A) True
B) False
B) False
Correct Answer

verified
Correct Answer
verified
Question 61
True/False
Figure 2-14  -Refer to Figure 2-14.Given the technology available for manufacturing doghouses and dishwashers,this economy does not have enough of the factors of production to support the level of output represented by point C.
A) True
B) False
B) False
Correct Answer

verified
Correct Answer
verified
Question 62
True/False
A circular-flow diagram is a visual model of the economy.
A) True
B) False
B) False
Correct Answer

verified
Correct Answer
verified
Question 63
True/False
The Council of Economic Advisers consists of thirty members and a staff of several dozen economists.
A) True
B) False
B) False
Correct Answer

verified
Correct Answer
verified
Question 64
True/False
When a variable that is named on an axis of a graph changes,the curve shifts.
A) True
B) False
B) False
Correct Answer

verified
Correct Answer
verified
Question 65
True/False
A pie chart is a way to display information regarding two variables.
A) True
B) False
B) False
Correct Answer

verified
Correct Answer
verified
Question 66
True/False
When a production possibilities frontier is bowed outward,the opportunity cost of the second good in terms of the first good increases as more of the second good is produced.
A) True
B) False
B) False
Correct Answer

verified
Correct Answer
verified
Question 67
True/False
When a variable that is not named on either axis of a graph changes,we read the change as a movement along the curve.
A) True
B) False
B) False
Correct Answer

verified
Correct Answer
verified
Question 68
True/False
Figure 2-14  -Refer to Figure 2-14.The opportunity cost of moving from point B to point D is 15 doghouses.
A) True
B) False
B) False
Correct Answer

verified
Correct Answer
verified
Question 69
True/False
While the scientific method is applicable to studying natural sciences,it is not applicable to studying a nation's economy.
A) True
B) False
B) False
Correct Answer

verified
Correct Answer
verified
Question 70
True/False
Economic models omit many details to allow us to see what is truly important.
A) True
B) False
B) False
Correct Answer

verified
Correct Answer
verified
Showing 81 - 100 of 136
Related Exams